The below example study illustrates an analysis done with GENEVESTIGATOR® with a Smart-Seq RNA-Seq dataset that has been curated by the teams at NEBION. The curation included data processing, quality control, (sub)clustering, cell-type identification and cross-study harmonization, metadata annotation, and integration into the platform for visualization.
Study details
- GEO accession: GSE113973
- Falcão AM, van Bruggen D, Marques S, Meijer M, Jäkel S, Agirre E, Samudyata, Floriddia EM, Vanichkina DP, Ffrench-Constant C, Williams A, Guerreiro-Cacais AO, Castelo-Branco G. Disease-specific oligodendrocyte lineage cells arise in multiple sclerosis. Nat Med. 2018 Dec;24(12):1837-1844
- Smart-seq2, single-cell level
- Spinal cord cells from mock/healthy mouse and multiple sclerosis mouse model
- 1740 high-quality cells
Cell type analysis
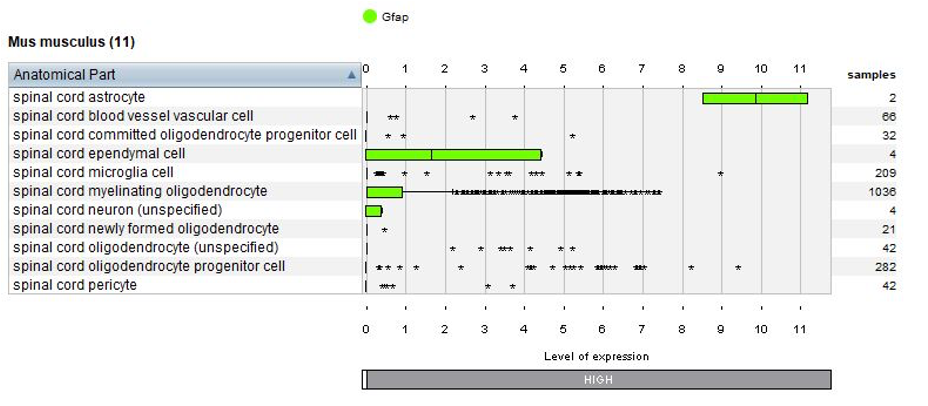
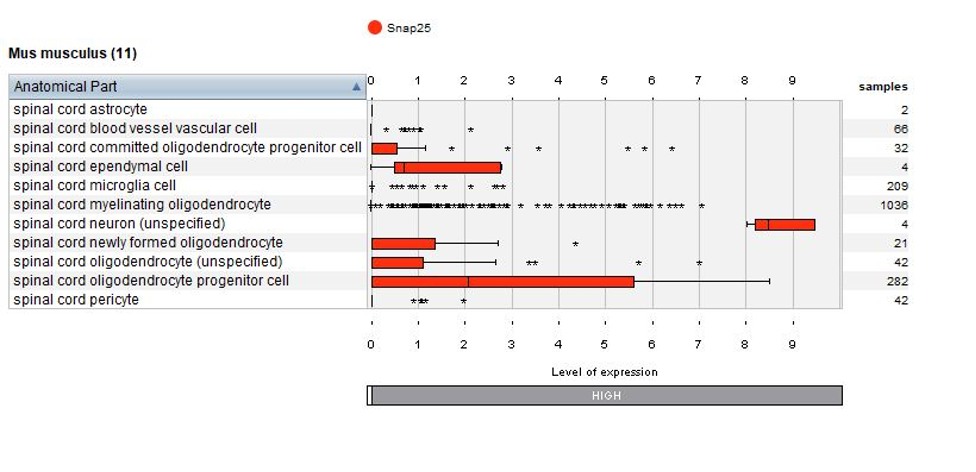
Thanks to the use of NEBION’s cell-type references, our biocurators were able to identify 11 anatomies while the original publication had identified 8. Using harmonization with other neurology studies, we could identify rare cell types – 2 astrocytes and 4 neurons - and these cells clearly express the astrocyte marker gene Gfap or neuron marker gene Snap25. The below plots display the summary view from the GENEVESTIGATOR® Samples tool, as generated using the “Plot groups…” feature.
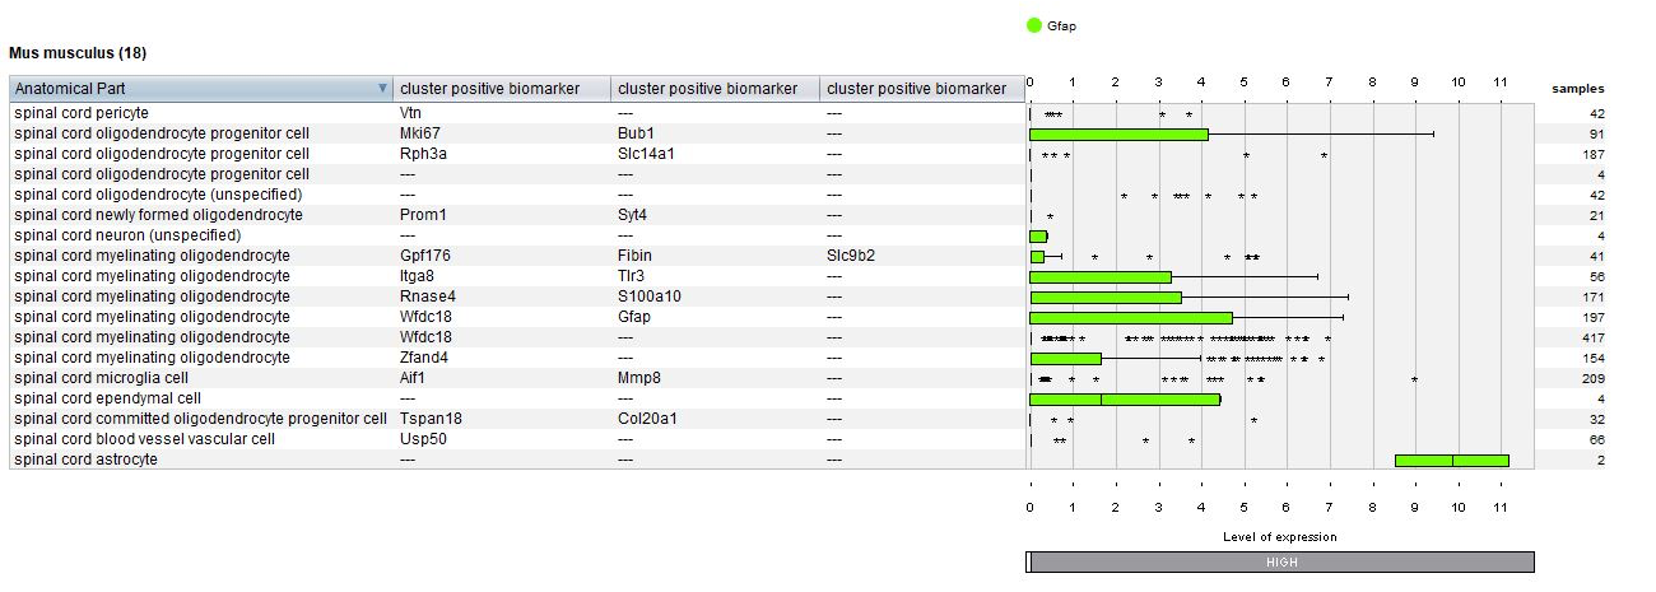
Biomarkers used in the publication and calculated by Seurat are annotated – this enables users to match the NEBION annotation with the publication.
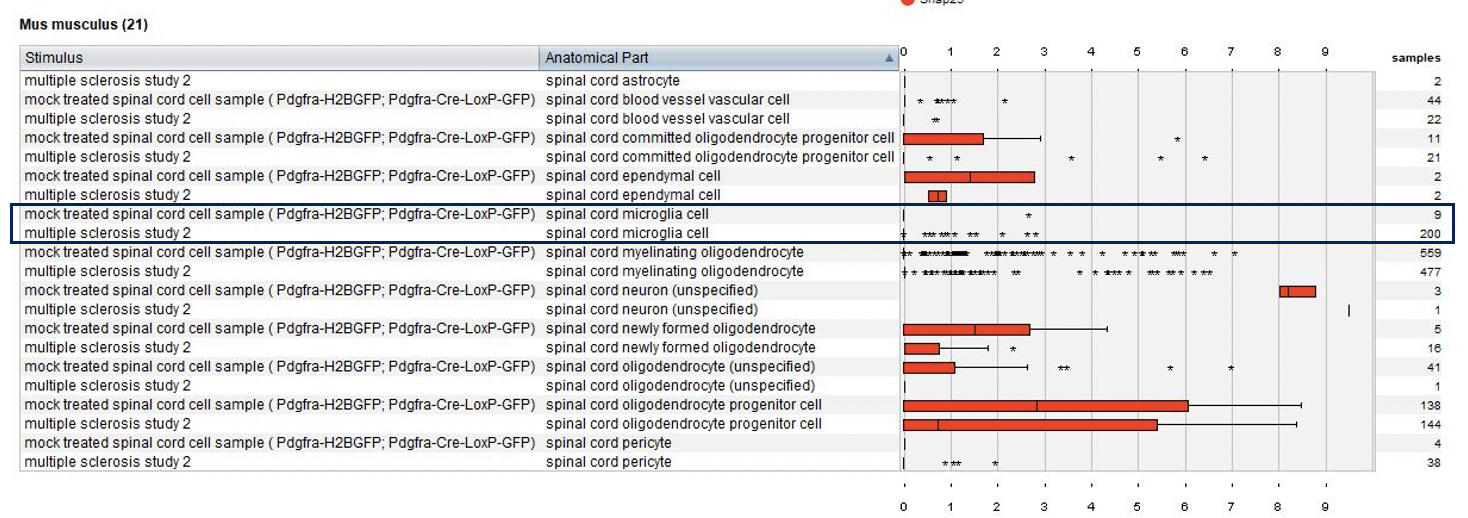
Using the Samples summary view again, we plotted cell types and tested conditions (mock treated and diseased). Notable observation: microglia are present only in multiple sclerosis lesions.
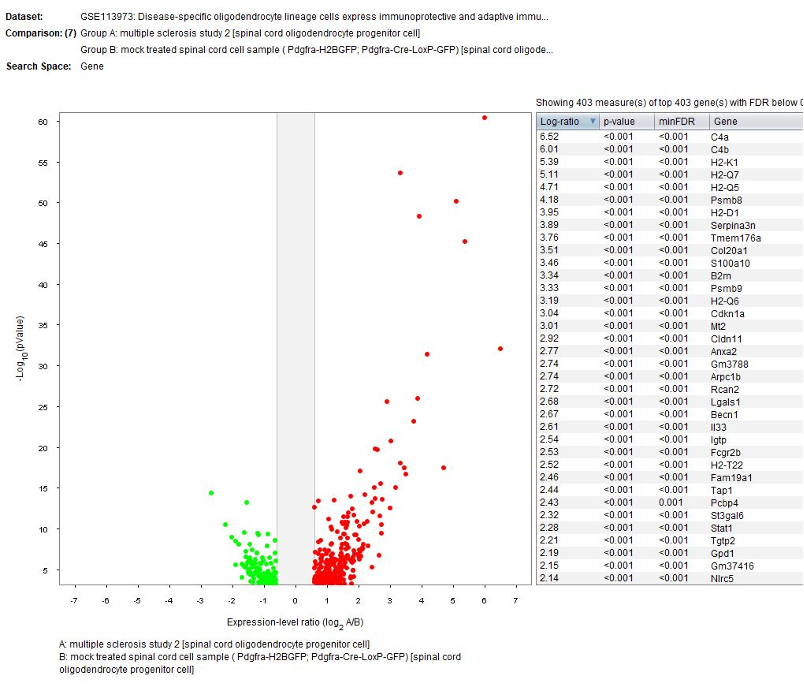
Differential expression analysis
The GENEVESTIGATOR® Differential Expression tool was used to identify genes differentially regulated in cell type clusters between mock treated and multiple sclerosis.
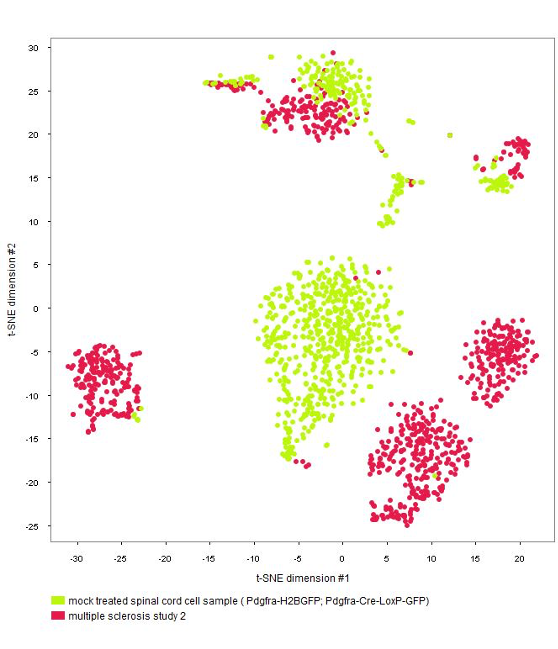
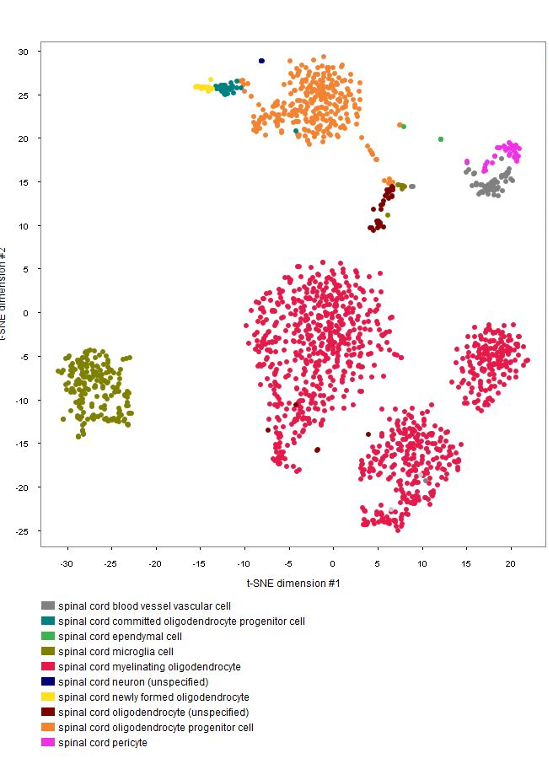
Clustering analysis of cells (Dimension Reduction tool)
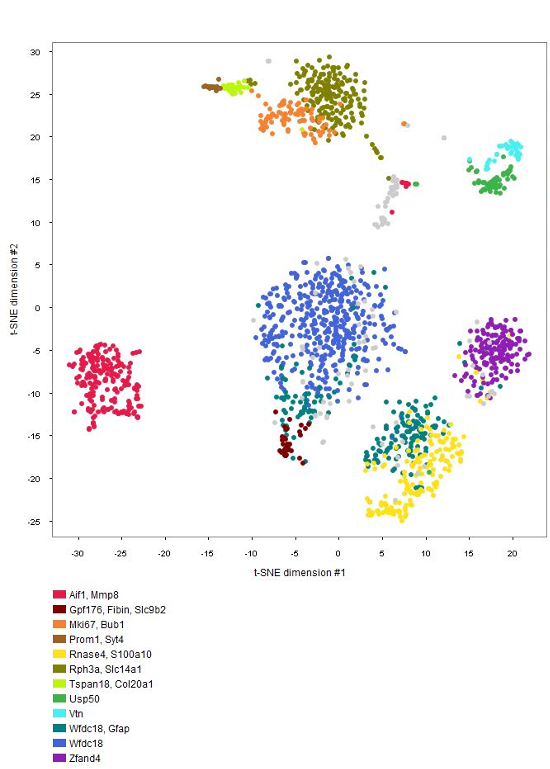
The GENEVESTIGATOR® Dimension Reduction tool allows clustering of individual cells and coloring them either by disease and treatment, cell type, or by the marker genes chosen by the authors of the study, as shown in the below plots. (Note: NEBION uses its own cell-type markers based on the combined analysis of many studies and establishment of cell-type references. The markers used by the original publication are annotated to allow users to match our annotation with the publication)
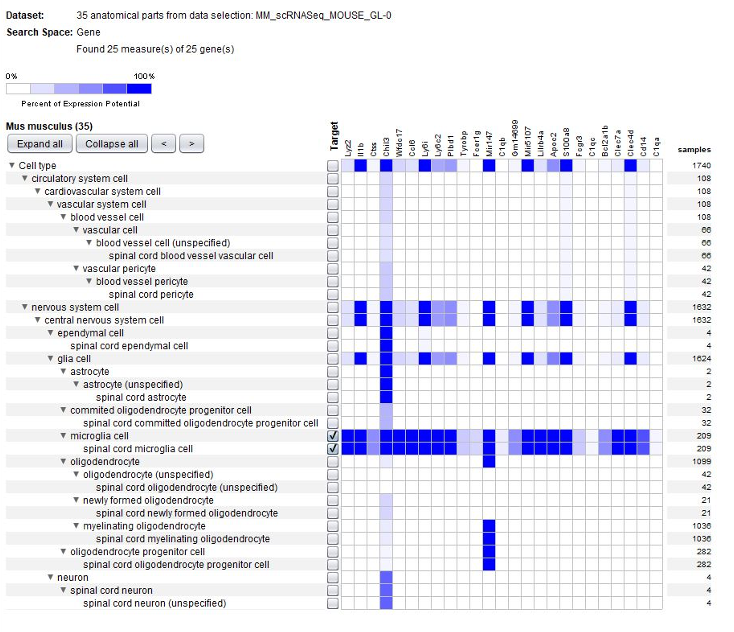
Cell-type marker genes
GENEVESTIGATOR® can be used by scientists analyzing their own single-cell data to identify cell-type specific marker genes. NEBION has established detailed and accurate cell-type references that are harmonized across many studies. The GENE SEARCH tools allow making use of our extensive collection of well-characterized studies to identify novel markers for individual or groups of cell types. This is one of the favorite tools of single-cell scientists.
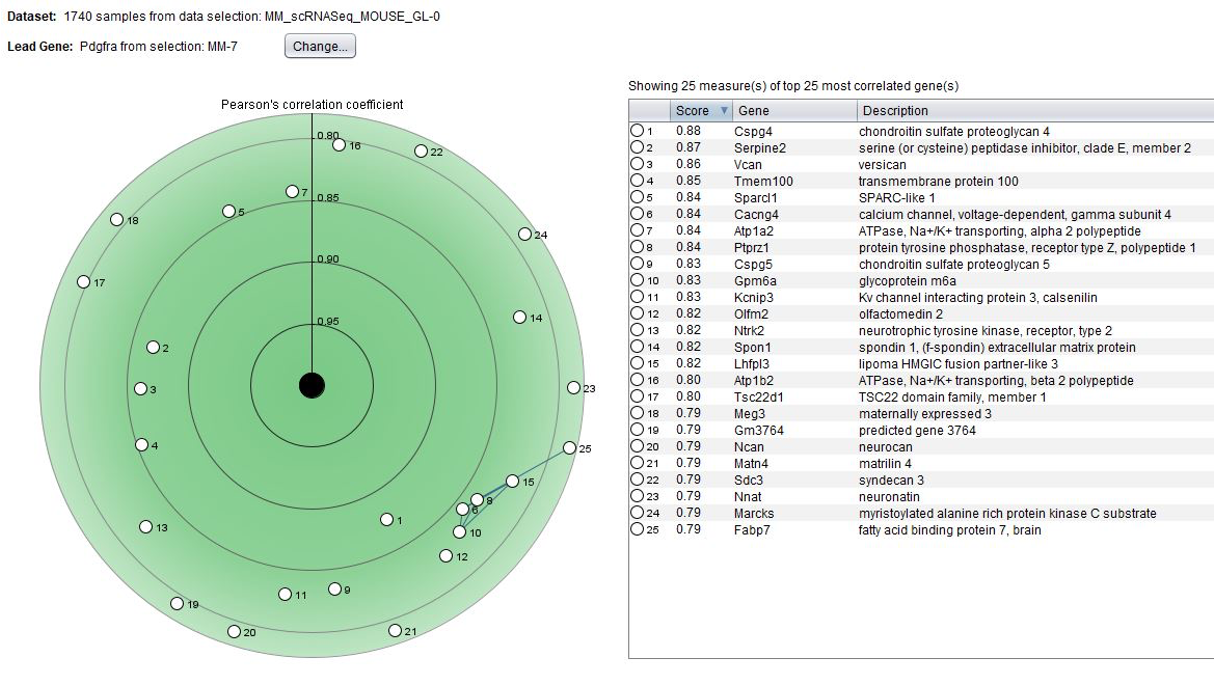
To expand on cell-type specific markers, the GENEVESTIGATOR® Co-Expression tool allows searching for genes co-expressed by anatomy across selected data compendia. In the below example, we looked for genes having a similar anatomical profile to pdgfra, a marker for spinal cord oligodendrocyte progenitor cells.
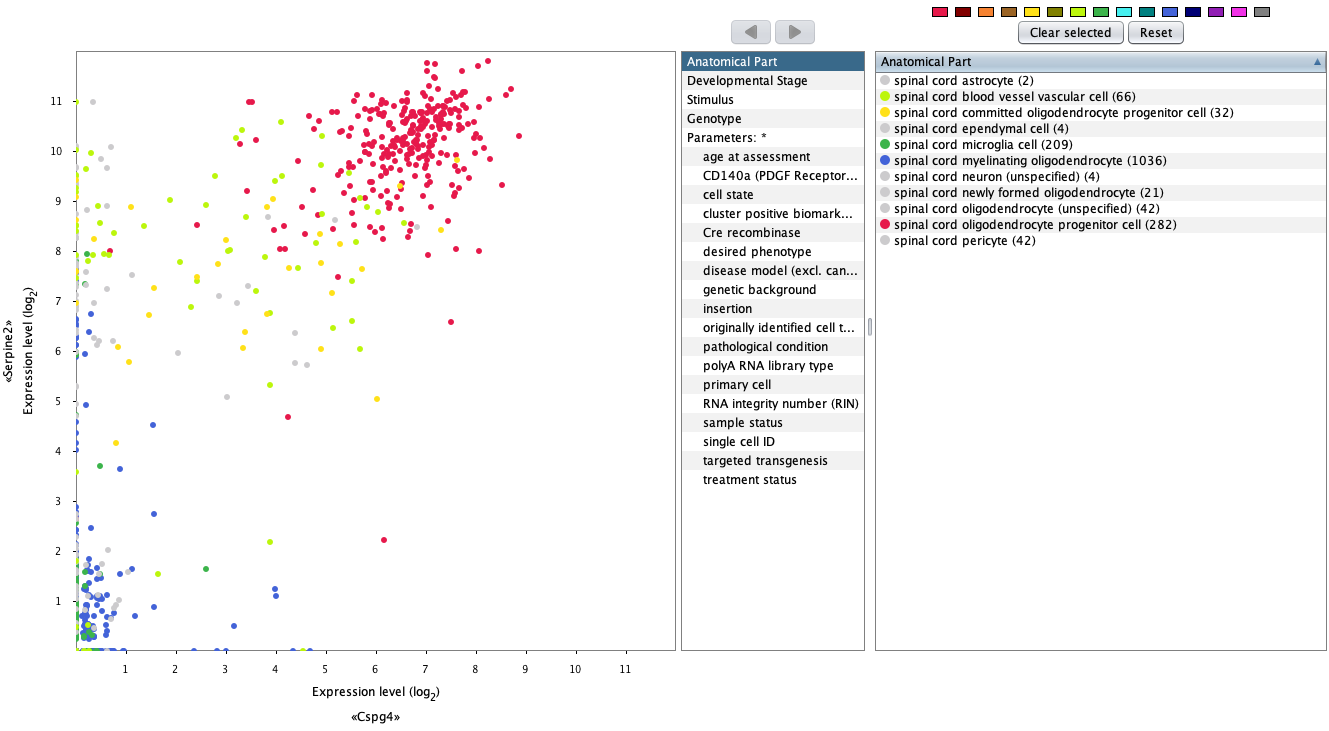
Comparing two genes across cell types
The GENEVESTIGATOR® 2-Gene Plot tool was designed to compare the expression of a pair of genes across either anatomies, cell lines, cancers, diseases or other perturbations. For single-cell analysis, it can be used to select individual cells in which either or both genes show a strong expression. Cells from chosen cell types can be highlighted in different colors, as illustrated below by highlighting spinal cord oligodendrocyte progenitor cell, and used for further analysis focused on the specific subset of cells.
Summary
With GENEVESTIGATOR®, single-cell scientists and biologists without specific single-cell training can easily visualize and analyze studies on the single-cell level. In this example, we were able to:
- Visualize and analyze 1740 cells isolated from healthy/multiple sclerosis mice (all tools)
- Create summary views by selected cell types and conditions (Samples tool)
- Choose subsets of cells having chosen characteristics (several tools)
- Find marker genes for chosen cell types across multiple studies (Gene Search Anatomy tool)
- Generate robust marker signatures (Co-Expression tool)
- Find genes differentially regulated between two conditions in chosen cell types (Differential Expression tool)
Access to curated single-cell studies
The presented study is freely available on GENEVESTIGATOR® for all users for demonstration purposes. Various compendia of deeply curated single-cell studies, such as our Neurology compendium, are available upon subscription. To access our deeply curated compendia on GENEVESTIGATOR®, please contact us at sales@nebion.com.