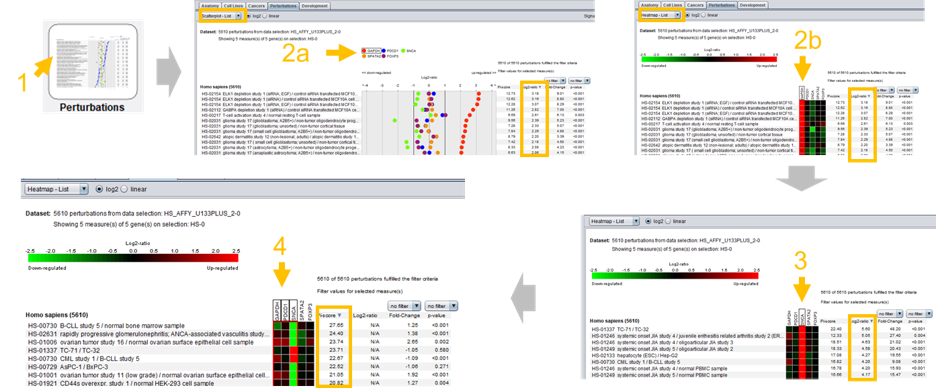
The Perturbations tool in the Condition Search toolset (1) helps to identify comparisons in which your gene(s) of interest are up- or downregulated compared to the average expression across the selected data.
The comparisons / perturbations shown on the left of the plot are originally ordered by descending log2-ratio of the selected gene.
By default, the first gene of your gene list is selected and marked with a black box above the plot (2a and 2b).
Another gene can be selected by clicking (3) and multiple genes can be selected by CTRL /SHIFT-clicking (4).
In this case, the perturbations shown on the left of the plot are ordered by the Pi-score calculated from all genes in the selection.