In this blog post we focus on the modeling of SARS-CoV-2 infection ex vivo. In a recently published study (https://pubmed.ncbi.nlm.nih.gov/33128895/), Katsura et al. developed a novel chemically defined (serum-free) 3D organoid culture system of primary human alveolar type 2 cells (AT2s) for modeling of SARS-CoV-2 infection ex vivo. The bulk RNA-Seq data (GSE152586, HS-03679) were processed and curated by Nebion experts and are available to all GENEVESTIGATOR® users from Dec 2020.
Using the Anatomy tool in GENEVESTIGATOR® we visualized expression of the entry receptor of SARS-CoV-2 (ACE2) and of the priming protease (TMPRSS2) in this novel organoid system in the context of other primary lung cell types (Figure 1).
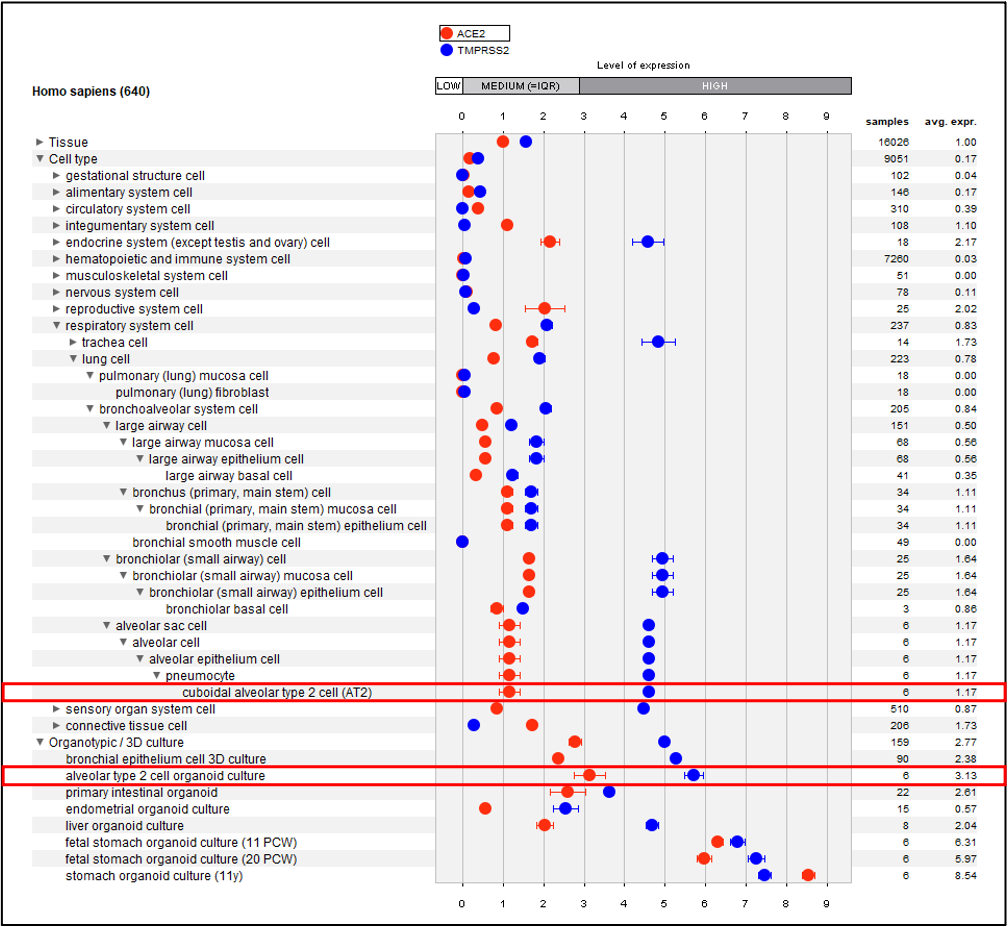 Figure 1: Gene expression of ACE2 and TMPRSS2 across tissues, cell types and organotypic/3D cultures of curated mRNA-seq compendium. Only lung cell types and organotypic/3D cultures are expanded from 640 tissues/cell types/cultures tested. AT2 cell organoid cultures from HS-03679 study and AT2 cells are highlighted.
A differential expression analysis of the SARS-CoV-2 infected vs. mock-infected AT2 organoid cultures using FDR < 0.01 and Fold-Change > 2 revealed 1138 up-regulated and 415 down-regulated genes. We used the top 200 most up-regulated and 200 down-regulated genes as a signature of SARS-CoV-2 infection in AT2 organoids under laboratory conditions and compared it to the regulation pattern of these genes in vivo in COVID-19 patients. First, we used the GENEVESTIGATOR® Signature tool to compare our signature to a single-cell sequencing study of bronchoalveolar cells from COVID-19 patients (Figure 2A). Unexpectedly, the most similar pattern of regulation was observed in macrophages of COVID-19 patients compared to healthy controls. A comparison of AT2 cells in the COVID-19 patients to healthy controls showed a markedly lower similarity (Figure 2, red rectangle). We also noted that most of the strongly up-regulated genes identified in the in vitro system were also up-regulated in COVID-19 patients in vivo across different cell types, while the pattern seems to be much less consistent for down-regulated genes. Interestingly, in comparisons of critically/severely ill COVID-19 patients vs. moderate cases (Figure 2, blue rectangle), some of the genes up-regulated by in vitro infection were in contrast down-regulated.
Next, we performed the same type of signature similarity analysis on bulk mRNA-sequencing studies of COVID-19 patient blood leukocyte samples (Figure 2B). Many of the up-regulated genes identified in the in vitro infection of AT2-organoids also showed up-regulation in comparisons of COVID-19 patients vs. healthy blood leukocyte samples. Interestingly, comparisons of critical vs. less severe COVID-19 cases confirmed our observation made in bronchoalveolar cell samples sequenced at the single-cell level.
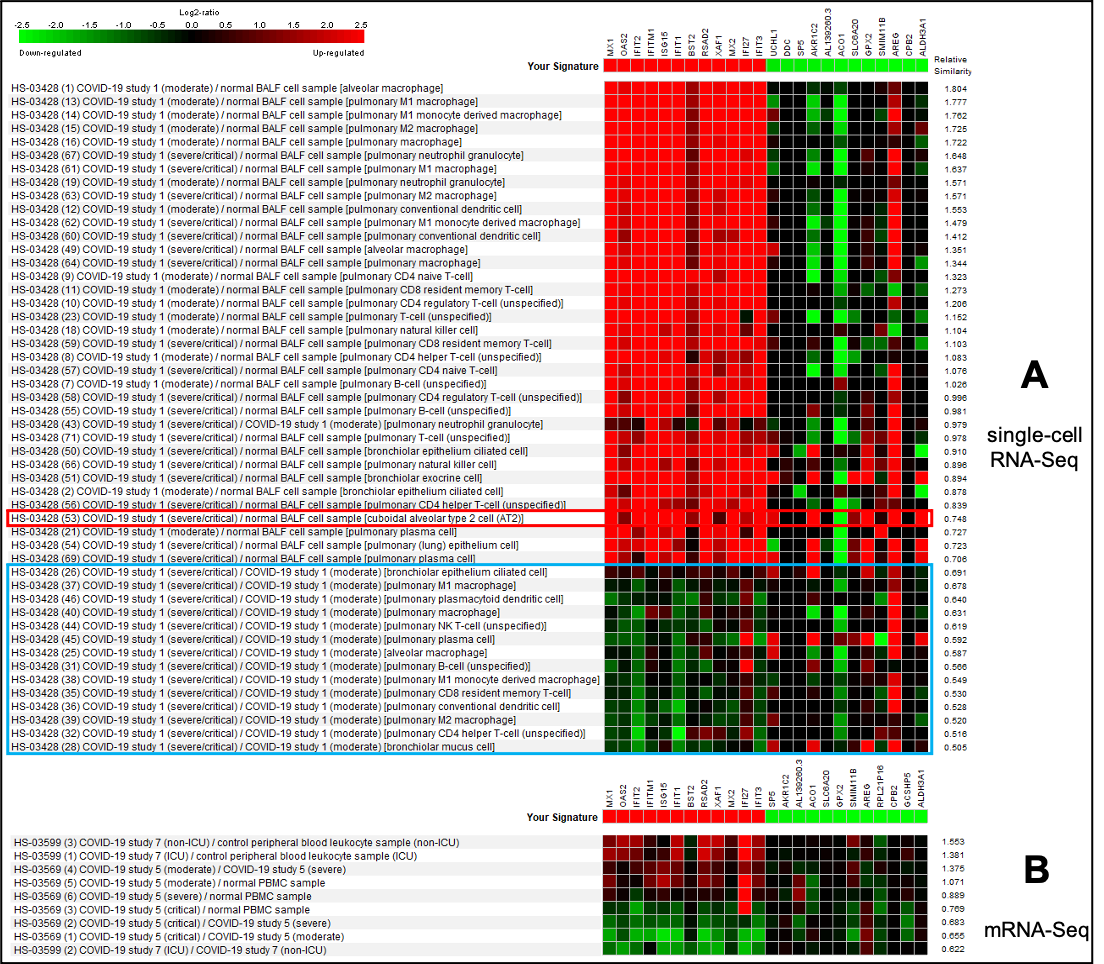 Figure 2: The most similar COVID-19 perturbations to the signature of SARS-CoV-2 infection in AT2 organoid culture on mRNA-Seq and single-cell RNA-Seq platforms. Data selection: HS-03428 (single-cell RNA-Seq, Fig. 2A) and HS-03569, HS-03599 (mRNA-Seq, Fig. 2B); the most similar, Pearson correlation. Depicted only top 12 up and 12 down-regulated genes.