A recent single-cell RNA-Seq study published in Nature Immunology caught our attention. In the publication “Mapping systemic lupus erythematosus heterogeneity at the single-cell level”, Nehar-Belaid and colleagues investigate the complex blood transcriptome of patients with systemic lupus erythematosus (SLE). About 358,000 peripheral blood mononuclear cells were sequenced using a 10x Genomics Chromium protocol. As this study is well designed, carefully conducted, and includes data from patients of different ages, it is a valuable resource to investigate transcriptomic changes of SLE in great detail.
The authors deposited the raw data in the controlled-access database of Genotypes and Phenotypes (dbGaP) under the accession code phs002048.v1.p1. NEBION received permission to curate this study and integrate it in GENEVESTIGATOR®. Users who have licensed the single-cell compendium “Immune System” can analyze and visualize this study with GENEVESTIGATOR®ID HS-03902 on an aggregate level.
NEBION’s state-of-the-art curation pipeline uses the latest algorithms for cell clustering, batch-effect removal, and normalization. For the present study, this resulted in a refined cell-type identification, where additional cell types, such as peripheral blood γδ T cells, were found. As part of NEBION’s curation, the metadata were enriched using controlled vocabulary, including cell-level annotations. This consistency allows for the analysis of the present study in GENEVESTIGATOR® either on its own or as part of a compendium together with numerous other studies.
What molecular insights can be gained by analyzing this study in GENEVESTIGATOR®?
Analysis of public transcriptomic data in GENEVESTIGATOR® allows for the investigation of genes or conditions at the highest level of resolution. At the same time, users can analyze large and complex single-cell studies within a few seconds and using a few clicks. All the valued tools for bulk-tissue data analysis are fully compatible with the single-cell data. Hence, there are many different workflows to investigate a single-cell study. For an example of such an analysis, see here.
In the following, we list some ideas for the reanalysis of this SLE RNA-Seq study in GENEVESTIGATOR®:
- Find cell-type specific marker genes by comparing the expression patterns of different cell types, e.g., natural killer cells vs. all other immune cells
- Identify cell-type specific molecular changes associated with SLE by comparing the gene expression pattern of a particular cell type between healthy and diseased donors, e.g., γδ T cell from a healthy donor vs. γδ T cells from a diseased donor
- Discover molecular changes associated with SLE and other annotated parameters, e.g., by comparing the gene expression pattern of a particular cell type between healthy and diseased donors across different age groups
- Characterize your genes of interest by comparing the gene expression pattern across multiple parameters (e.g., disease state as shown in image) or grouping the genes by function using a gene set enrichment analysis
- Discover genes expressed together with your gene of interest by using a co-expression analysis
- Validate candidate genes from the analysis of this study in other single-cell or bulk-tissue studies
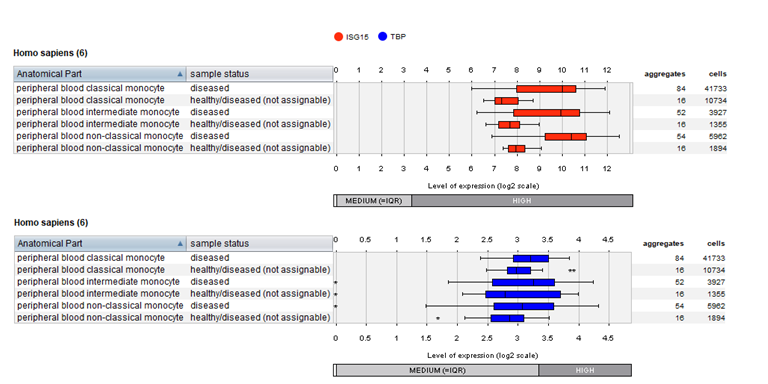 Gene expression levels of two genes in 65,605 monocytes grouped by disease state: As reported in the original publication, the Interferon-stimulated gene 15 (ISG15, in red) was upregulated in all monocyte subtypes when samples of SLE patients were compared to matched controls. Since control samples were from diseased donors whose medical condition is currently not known to be associated with SLE, they are labeled as “healthy/diseased (not assignable)”. As housekeeping gene, the gene expression of the TATA-binding protein (TBP, in blue) is displayed.