Single-cell RNA-Seq studies from 10x Chromium typically measure data from a very large number of cells. This causes significant challenges for biologists wishing to analyze such data.
Why build cell aggregates?
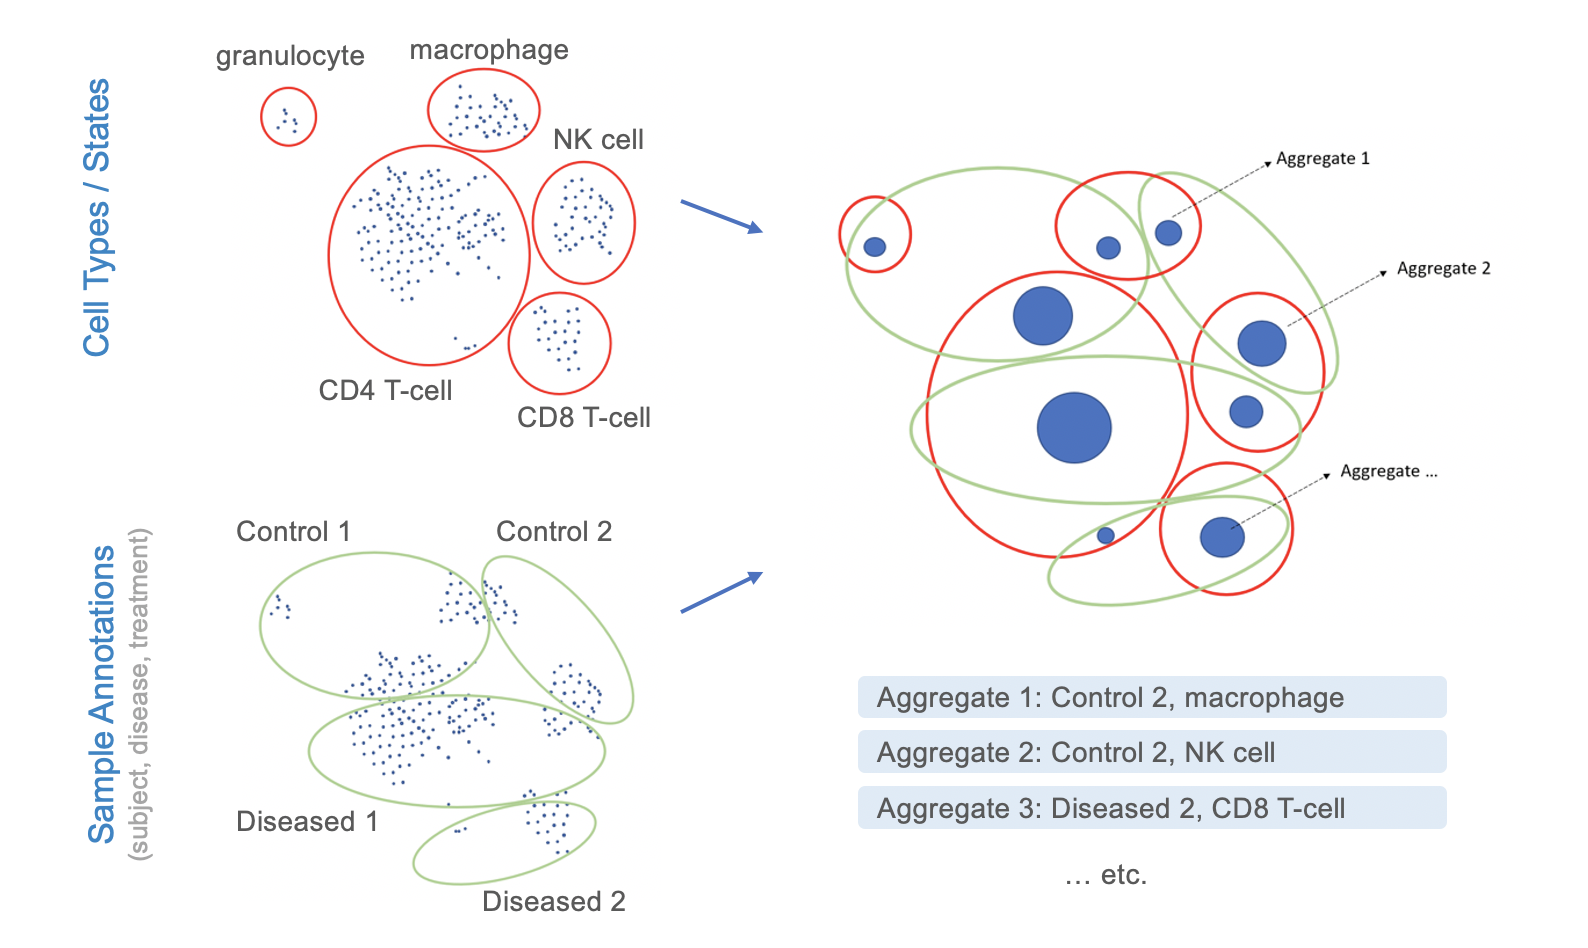
The goal of most studies is to ask questions like “Which cell types are affected by a given disease, and which genes in these cells are regulated in response to the disease?”. Processing the data, clustering the cells, identifying cell types, and running downstream analyses all require extensive processing capacities and bioinformatics expertise. At NEBION, we are convinced that biologists should not have to worry about these steps, but should be able to easily analyze the data by simply choosing cell types of interest and conditions being compared. To achieve this, our teams needed to come up with a solution of how to aggregate the data based on cell types, cell states, and experimental design conditions. The goal was to reduce the number of elements being analyzed from hundreds of thousands of cells to a few hundred aggregates, while maintaining the statistical power of the underlying data.
How we solved it
scRNA-Seq data are available in GENEVESTIGATOR® at two levels of resolution:
Single-cell level: Data from Smart-Seq libraries are featured as 1 sample = 1 cell.
Aggregate level: Data from droplet-based libraries are featured as 1 sample = 1 aggregate, where an aggregate is a group of cells from the same biosample that have shared attributes, e.g. cell type and cell state. Detailed information on the composition of each aggregate is available in the tooltip.
An example study that has been aggregated this way, and which is freely available to all GENEVESTIGATOR® users, is study HS-03428 (human study on an aggregate level). To explore this data set and try out how our aggregation works, simply use the keyword search of the data selection and enter “HS-03428”. Some screenshots from this study can also be seen here: