Liao et al. (2020) recently published a large single-cell RNA-Seq study performed on the 10x Chromium platform.
- GEO accession: GSE145926
- Liao M, Liu Y, Yuan J, Wen Y, Xu G, Zhao J, Cheng L, Li J, Wang X, Wang F, Liu L, Amit I, Zhang S, Zhang Z. Single-cell landscape of bronchoalveolar immune cells in patients with COVID-19. Nat Med. 2020 Jun;26(6):842-844
NEBION bioinformaticians and biocurators reprocessed the raw data and performed quality control, clustering, cell-type identification, sample annotation, aggregation of cells, and integration into GENEVESTIGATOR® . This study is freely available to all GENEVESTIGATOR® users, and another example analysis of the study is provided here. In this blog post, we look specifically at differential expression analysis in a chosen cell type and compare the results with other studies and with metabolic and regulatory pathways.
Aggregation in GENEVESTIGATOR®
After our quality control, we retained 58534 high-quality cells that were subsequently aggregated into 291 cell aggregates having common cell type / state / sample status. From these aggregates, 54 cell-type level comparisons were pre-defined by our curators.
Differential expression analysis
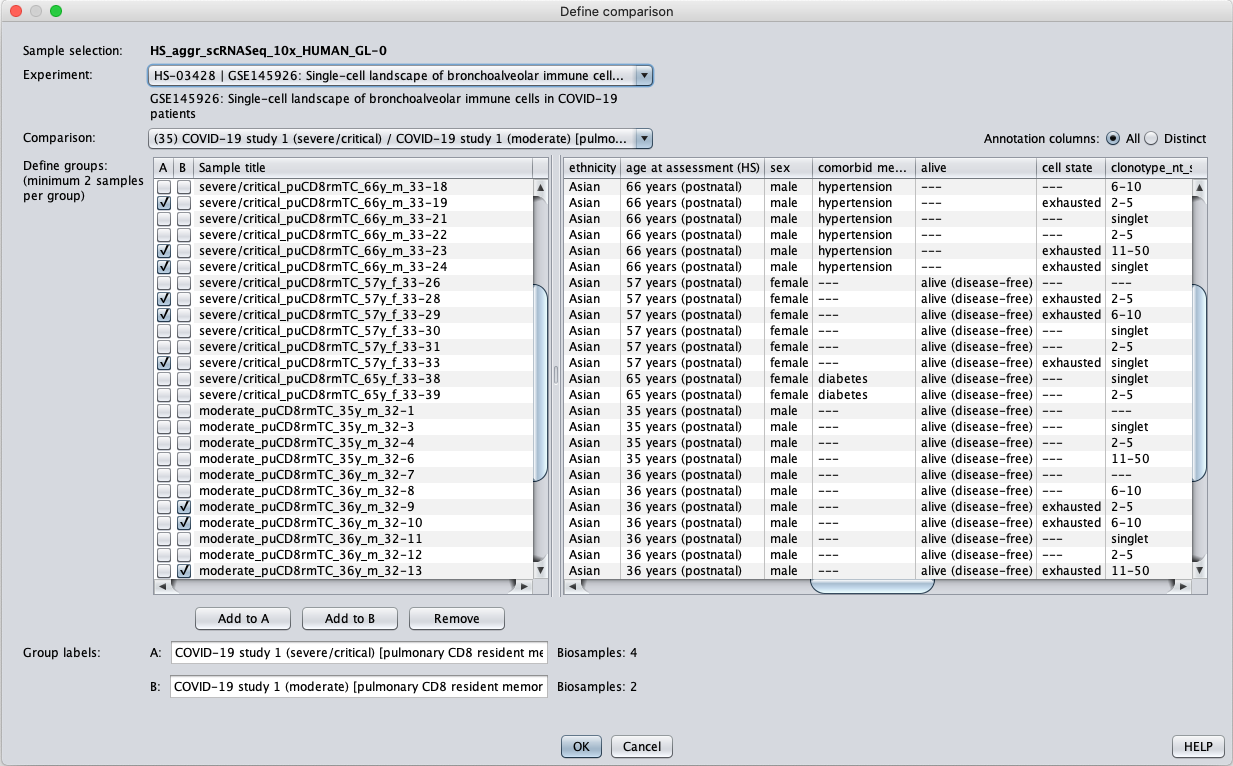
Using the GENEVESTIGATOR® Differential Expression tool, one can easily identify genes differentially expressed between two groups of samples or aggregates, either by choosing a comparison pre-defined by our curators, or by customly selecting samples for groups A and B. In this case, we chose the pre-defined comparison representing pulmonary CD8 resident memory T cells of patients with severe versus moderate COVID-19 disease. The “Define comparison…” dialogue displays which aggregates are pre-selected for this comparison, but users can add or remove aggregates of interest. For this example, we kept only aggregates with cell state “exhausted”, as annotated by our curators based on cell clusters strongly expressing the T-cell exhaustion marker, LAG3.
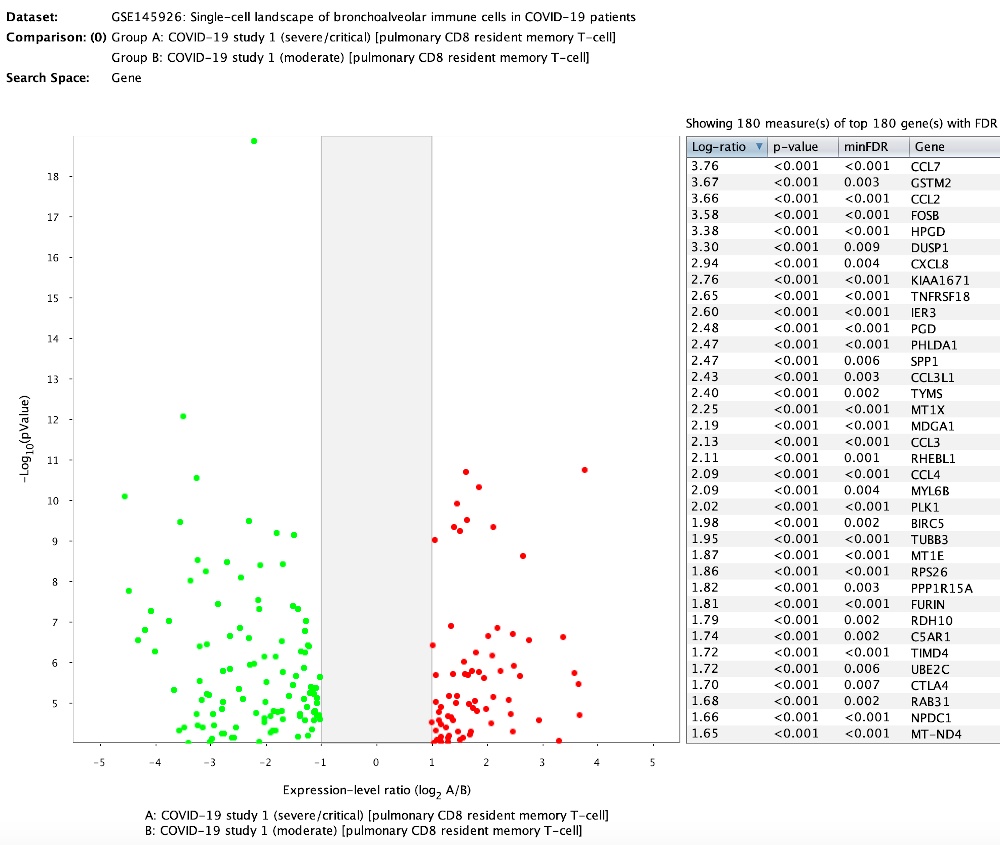
Differential expression analysis was performed using an FDR of 0.01 and log-2 ratio of 1 (2-fold change). The volcano plot shows genes either significantly up- or down-regulated in exhausted pulmonary CD8 resident memory T cells in severe versus moderate cases. The sets of up-regulated (71) and down-regulated (109) genes were stored as two new gene selections for further examination.
Comparison with other public data
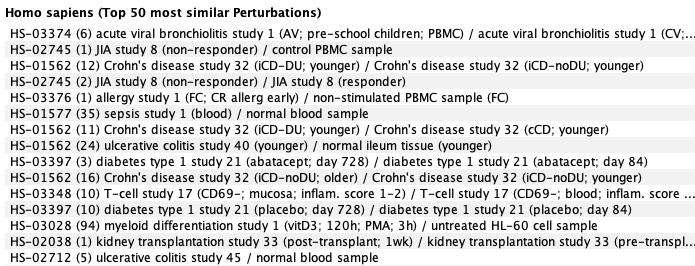
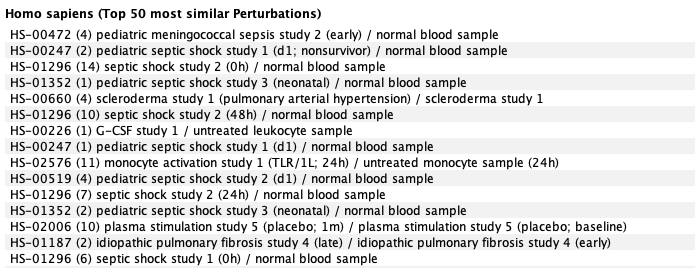
To contextualize the results obtained in the above differential expression analysis, we compared the results to curated compendia of human RNA-Seq and microarray data. The most correlated conditions are shown below. To do so, we created a gene signature and used it as a template in the GENEVESTIGATOR® Signature tool. This analysis showed that gene expression response to COVID-19 (severe versus moderate in CD8 T-cells) was similar to responses to acute viral bronchiolitis, sepsis, and several types of auto-inflammatory diseases.
Most correlated conditions from the human (bulk-tissue) mRNA-Seq compendium:
Most correlated conditions from the Affymetrix U133 Plus2 compendium:
Clustering of aggregates for top regulated genes
The perturbations profile of the 109 down-regulated genes were clustered against the 54 pre-defined comparisons from this study. The result shows two main clusters:
- Cluster A consists of genes that are up-regulated in response to COVID-19 across almost all cell types isolated in this study.
- Cluster B contains genes up-regulated in CD4 and CD8 T-cells in response to COVID-19 but were initially found in the differential expression analysis as being significantly down-regulated in severe versus moderate cases in CD8 T-cells. This list consists almost exclusively of genes from the TRA, TRB and TRG gene families.
Pathway analysis
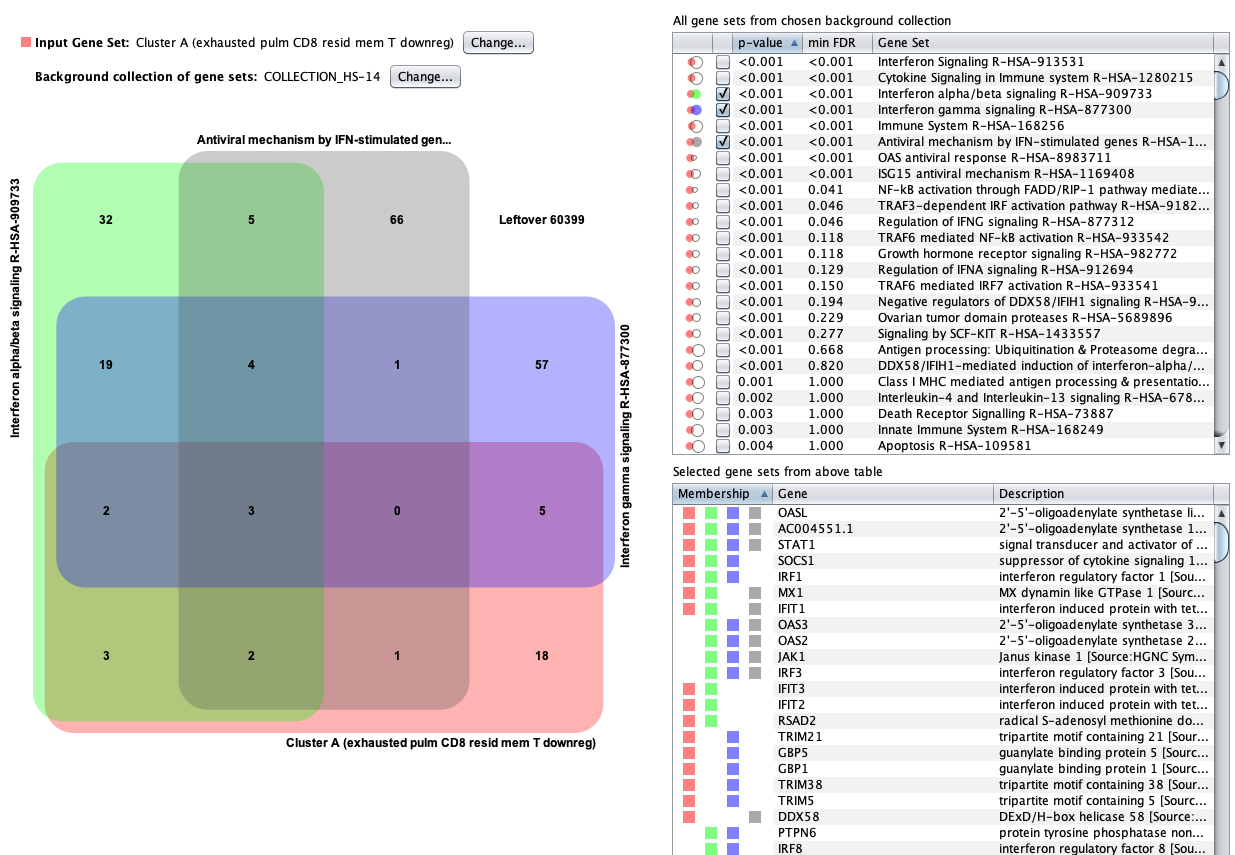
As a next step, we created a gene set from cluster A and performed enrichment analysis against Reactome Pathways. Using the GENEVESTIGATOR® Gene Set Enrichment tool, pathways having the highest over-representation of genes from cluster A were found to be related to anti-viral mechanisms, in particular interferon alpha, beta and gamma signaling.
Conclusions
- Despite the large number of cells and complexity of this study, thanks to NEBION’s data processing, cell-type identification, aggregation and pre-defined comparisons, within a few minutes we were able to identify cell-type specific responses to COVID-19.
- The aggregate level analysis yielded results similar to those in the original publication done entirely on the cell level.
- Our results could be instantly compared to those from thousands of curated public studies, showing inflammatory responses similar to a handful of other diseases.
- Pathway enrichment analysis showed that human anti-viral mechanisms are strongly up-regulated in diseased patients.
- We noticed (results not shown here) that in CD8 T cells, the main effects between severe disease versus moderate disease were from exhausted T-cells.